Do You Live in One of New York’s Liquor-Loving Zip Codes?
Have you ever wondered which cities and counties in New York have the highest number of liquor licenses? Or just how many establishments in the state are serving liquor daily?
Maybe you’re wondering why you would want to know that in the first place.
We think there are a few reasons. First, it’s interesting. New York and liquor have a long and storied history together. Tracing its presence across the state and throughout time tells us something about New Yorkers’ relationship with “the hard stuff.”
More importantly, as New York personal injury attorneys, we’re interested in the relationship between liquor consumption and auto accidents (as well as other types of injuries).
But first, let us be clear: it isn’t our mission to “liquor shame” anyone’s zip code. Alcohol is perfectly legal, and most adults are able to enjoy it safely, relying on moderation and designated drivers to avoid the risk of harm.
Still, it stands to reason that where there is a higher concentration of liquor licenses, there might also be a higher concentration of alcohol abuse. And to the extent that other people’s abuse of alcohol can interfere with your own safe use of the same substance — and the health and wellness of those around you — it’s worth noting. Indeed, as we will show below, there is some statistical overlap between the New York counties with the most liquor licenses and the counties with the highest number of DUI fatalities.
We’ve gone straight to the source — the New York State Liquor Authority — to get the following data for ourselves. The insights that follow are our own. We encourage you to browse the raw data we uncovered for yourself if you’re interested.
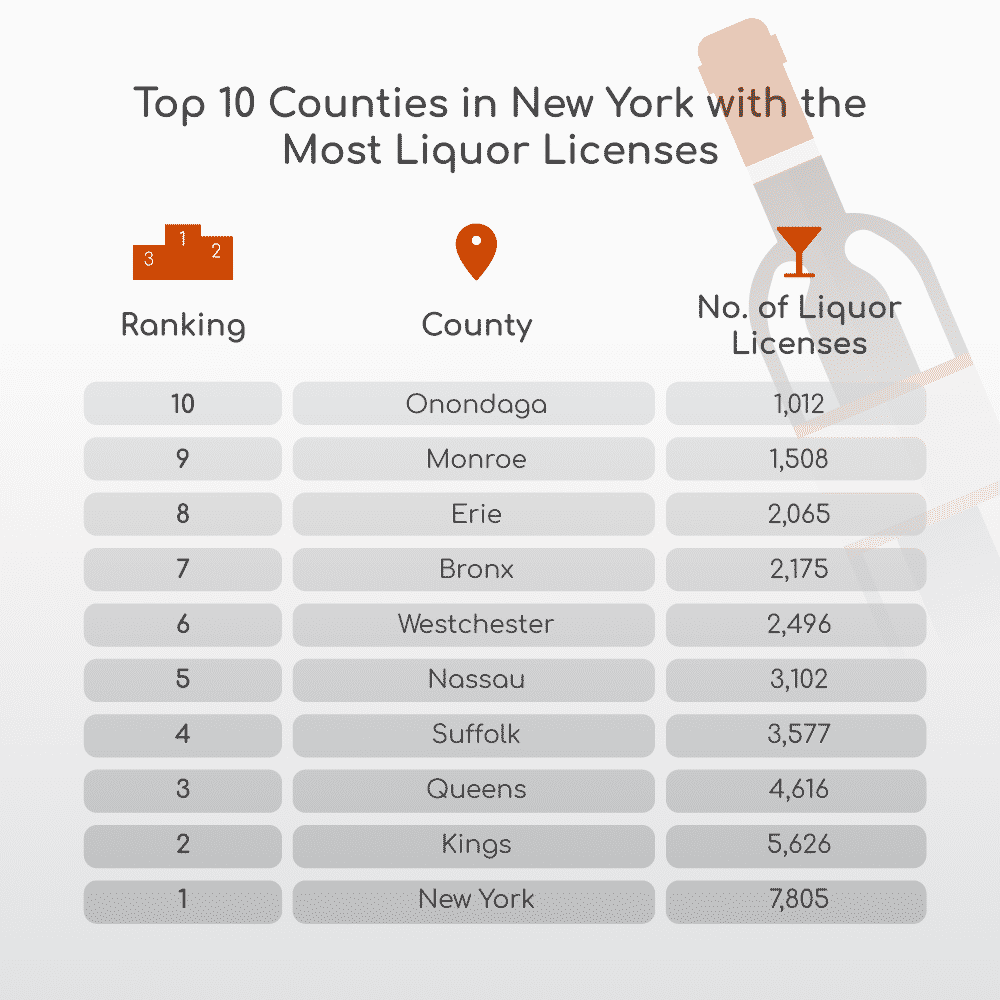
Top 10 Counties in New York with the Most Liquor Licenses
Let’s begin with a straightforward inquiry: which counties in New York have the highest total number of active liquor licenses?
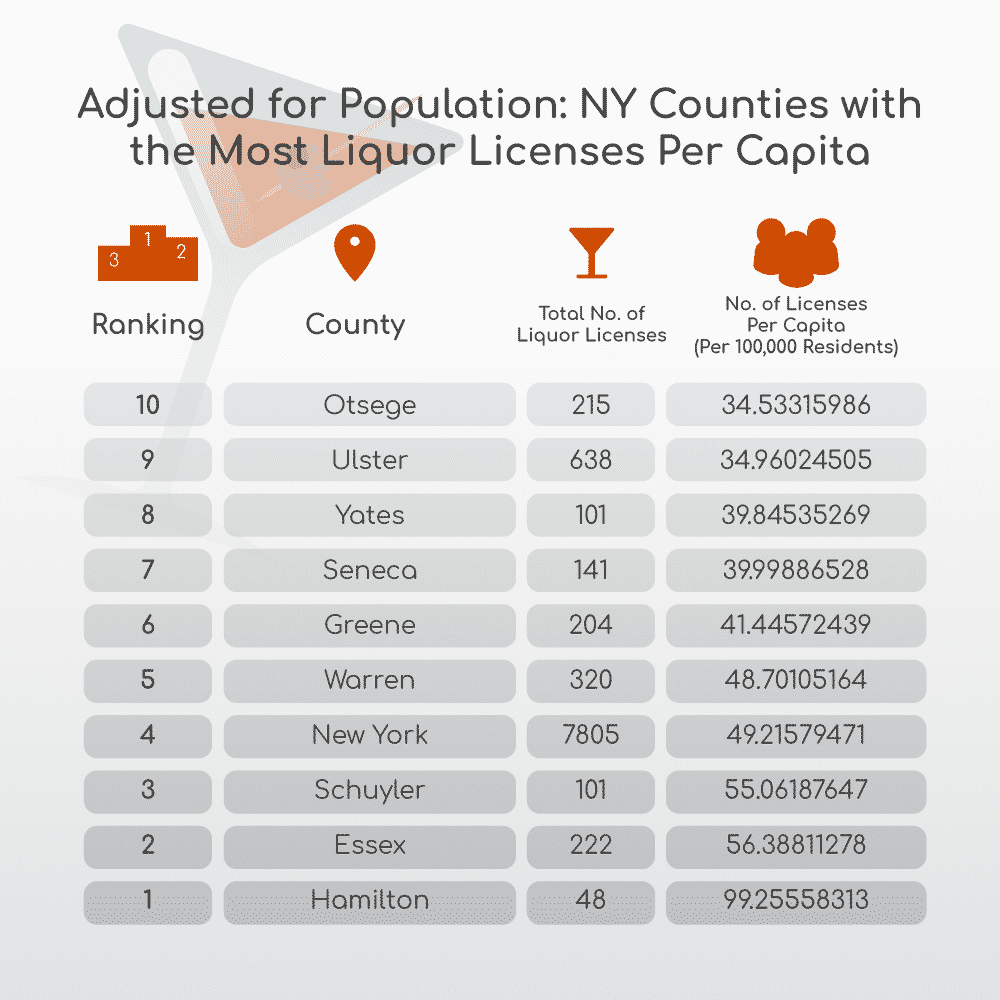
Adjusted for Population: NY Counties with the Most Liquor Licenses Per Capita
Interestingly, that list looks a lot different when we adjust it for population. As you’ll see below, only one of the above-listed counties (New York County) still makes the list.
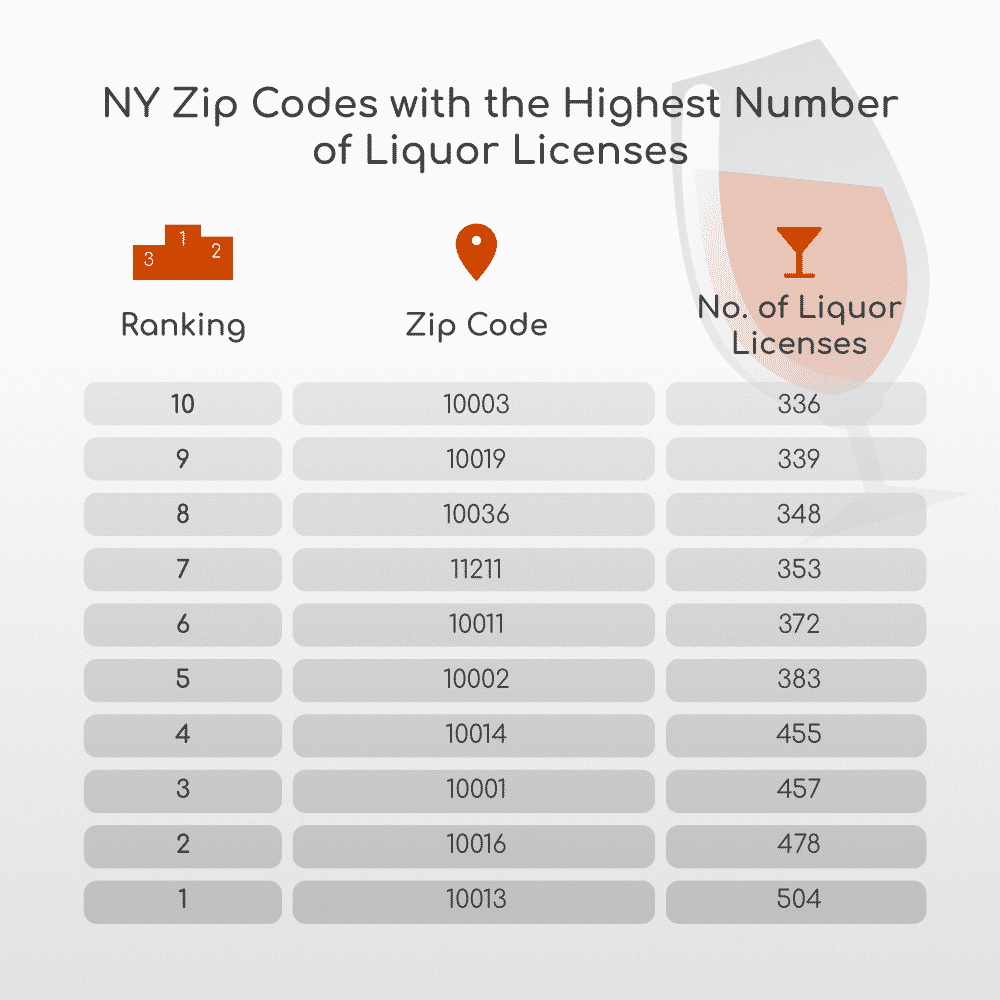
NY Zip Codes with the Highest Number of Liquor Licenses
Another way to look at the data? By zip code. Why? Because cities and counties often include multiple zip codes, by limiting our search to a single zip code at a time, we can get a better sense of just how locally concentrated liquor licenses are within a specific location.
The Top 10 New York zip codes with the largest number of liquor licenses are listed below. Do you live in one (or nearby)?
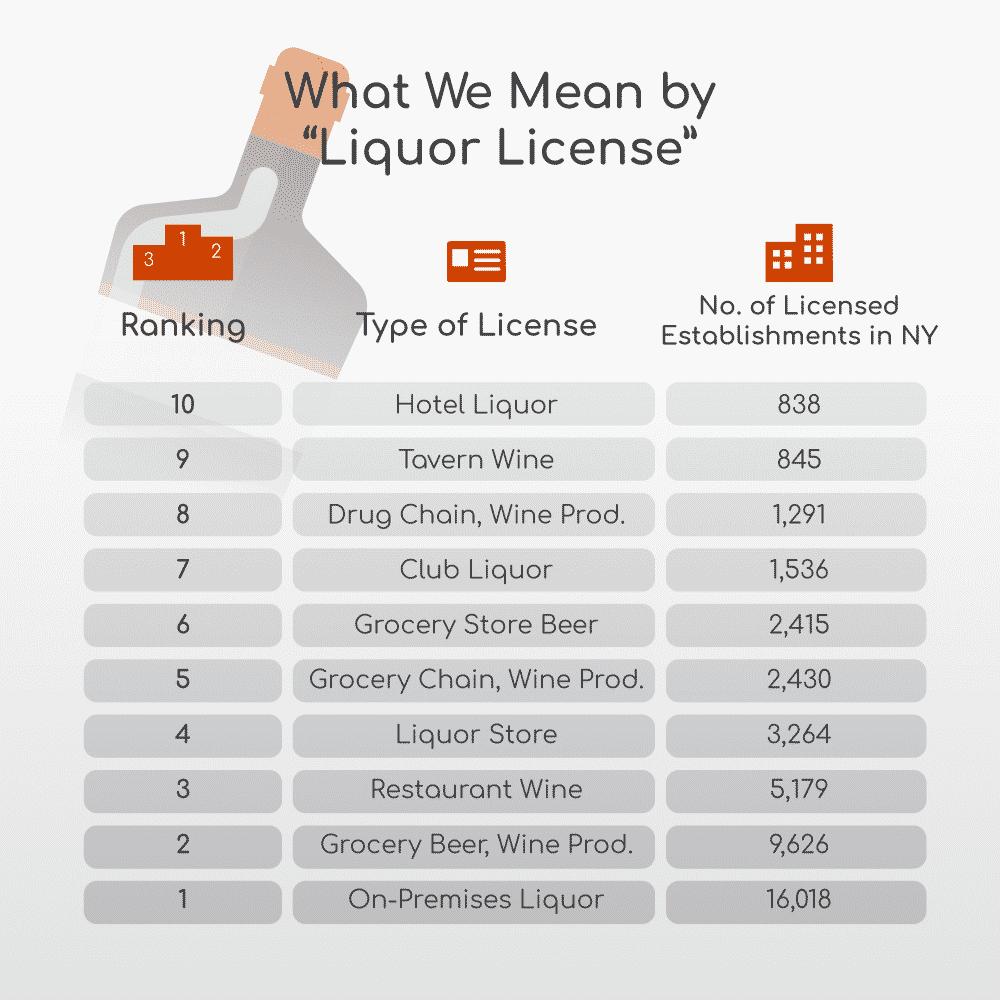
What We Mean by “Liquor License”
Not all liquor licenses are the same. The New York Liquor Authority (NYLA) issues different licenses for different purposes, with different regulations and restrictions applying to each. To get a better understanding of the liquor licenses in your area, we encourage you to contact the NYLA about the types of license most prevalent in your city, county, or zip code.
Below, we present the ten most common types of liquor license statewide:
How Long Has Your County Been in “High Spirits”?
Now for a little bit of trivia (because we came across this information during our research and found it fascinating… and we think you might too).
Find your county below, along with the date of its oldest active liquor license. Some counties have establishments that have been serving spirits for nearly 85 years. Others didn’t get started until the 1970s (or, at least, none of the earlier-established bars are still in business there).
You’ll notice that a lot of these liquor licenses date back to December 5, 1933 (or another date that same week), but no earlier. It’s no coincidence. It was on December 5th of 1933 that President Franklin D. Roosevelt signed Congress’s repeal of the 18th Amendment to the United States Constitution, effectively ending the national Prohibition.
The latest date on the list? October 1, 1978 — Columbia County.
| County | Oldest License Date |
| ALBANY | December 5, 1933 |
| ALLEGANY | December 7, 1933 |
| BRONX | November 10, 1936 |
| BROOME | February 6, 1946 |
| CATTARAUGUS | October 1, 1934 |
| CAYUGA | October 1, 1934 |
| CHAUTAUQUA | December 8, 1933 |
| CHEMUNG | December 5, 1933 |
| CHENANGO | October 1, 1976 |
| CLINTON | June 3, 1944 |
| COLUMBIA | October 1, 1978 |
| CORTLAND | July 18, 1945 |
| DELAWARE | July 8, 1966 |
| DUTCHESS | July 16, 1934 |
| ERIE | December 5, 1933 |
| ESSEX | August 7, 1946 |
| FRANKLIN | September 20, 1945 |
| FULTON | April 1, 1934 |
| GENESEE | July 13, 1937 |
| GREENE | January 17, 1947 |
| HAMILTON | October 1, 1977 |
| HERKIMER | October 1, 1935 |
| JEFFERSON | October 1, 1940 |
| KINGS | September 25, 1934 |
| LEWIS | November 23, 1966 |
| LIVINGSTON | June 26, 1947 |
| MADISON | October 1, 1934 |
| MONROE | August 1, 1933 |
| MONTGOMERY | June 15, 1935 |
| NASSAU | December 16, 1940 |
| NEW YORK | December 5, 1933 |
| NIAGARA | December 3, 1933 |
| ONEIDA | March 31, 1935 |
| ONONDAGA | December 5, 1933 |
| ONTARIO | March 16, 1946 |
| ORANGE | October 10, 1934 |
| ORLEANS | April 1, 1935 |
| OSWEGO | July 23, 1934 |
| OTSEGO | August 10, 1950 |
| PUTNAM | April 28, 1950 |
| QUEENS | May 5, 1944 |
| RENSSELAER | November 6, 1948 |
| RICHMOND | May 11, 1956 |
| ROCKLAND | March 30, 1962 |
| SARATOGA | December 27, 1950 |
| SCHENECTADY | January 20, 1956 |
| SCHOHARIE | August 29, 1962 |
| SCHUYLER | October 1, 1934 |
| SENECA | October 1, 1938 |
| ST LAWRENCE | July 29, 1946 |
| STEUBEN | December 5, 1933 |
| SUFFOLK | July 1, 1947 |
| SULLIVAN | March 8, 1962 |
| TIOGA | October 1, 1935 |
| TOMPKINS | December 5, 1933 |
| ULSTER | April 5, 1949 |
| WARREN | January 2, 1963 |
| WASHINGTON | June 1, 1965 |
| WAYNE | December 22, 1939 |
| WESTCHESTER | December 3, 1933 |
| WYOMING | April 22, 1944 |
| YATES | November 17, 1939 |
Key Takeaways
So what are we supposed to take away from all this data? Why does it really matter?
First, two observations immediately stand out to us:
- The Bronx has the lowest number of liquor licenses per 100,000 residents in all of New York.
- 12 of the 15 zip codes with the most liquor licenses are in Manhattan.
Beyond that, though, we were struck by a correlation between the Liquor Authority’s data and a completely different data set we uncovered when researching our recent article on the New York counties with the highest percentage of fatal DUI accidents. The latter data set comes to us from the National Highway Traffic Safety (NHTSA).
What we’ve found is that many of the same counties appeared in both data sets.
The following eight counties appeared in both the Top 10 Counties in New York with the Most Liquor Licenses and the Top 10 Counties in New York with the Highest Number of DUI Fatalities (both lists unadjusted for population):
- Westchester County (35 DUI deaths)
- Onondaga County (38 DUI deaths)
- Kings County (39 DUI deaths)
- Monroe County (43 DUI deaths)
- Erie County (49 DUI deaths)
- Queens County (64 DUI deaths)
- Nassau County (73 DUI deaths
- Suffolk County (148 DUI deaths)
When we adjust those lists per capita, we find that four counties appear on both the Top 10 Counties in New York with the Most Liquor Licenses Per Capita and the Top 10 Counties in New York with the Highest Number of DUI Fatalities Per Capita:
- Yates County (1.97 DUI deaths per 10,000 residents)
- Greene County (2.03 DUI deaths per 10,000 residents)
- Hamilton County (2.07 DUI deaths per 10,000 residents)
- Seneca County (2.55 DUI deaths per 10,000 residents)
We certainly aren’t suggesting that these counties should stop serving liquor, nor that the state should restrict the number of licenses there.
Rather, we are merely urging residents in these areas to exercise caution, especially at night and on weekends, when DUI accidents tend to be more common.
Talk to a New York DUI Injury Lawyer at Siler & Ingber, LLP
Far too many people have lost their lives at the hands of drunk drivers in New York. If you or your loved one has been injured or killed in a Long Island DUI accident, you may be entitled to substantial financial compensation. Please contact an experienced Long Island DUI Accident lawyer at Siler & Ingber, LLP right away.
Call 516-294-2666 or contact us online to get started with a free consultation.

The Impact Of Marijuana Legalization
Would New York legalizing recreational marijuana increase road accidents? We took a look at the stats in our latest study.
View StudyThe Law Office of Siler & Ingber, LLP
Phone:
1.516.294.2666
Address:
301 Mineola Blvd. Mineola, NY 11501
Subscribe to our Newsletter
SubscribeThis is a unique website which will require a more modern browser to work!
Please upgrade today!
